


Organizational Leadership & Change Management | Decision-Making
Last month I had the opportunity to collaborate with Kawai Lai, a former Education Elements (EE) teammate who recently founded VizLit with Lisa Kay Solomon and Dan Roam. Kawai and I are working together to create a Responsive Org Playbook for EE (sneak peek here). We believe the playbook will help us clarify our organizational design, support us to continue evolving as a company, and enable us to share our responsive practices with others (and build on what we’ve already shared with The NEW School Rules). During our three days huddled in a room together, it became increasingly clear to me that visuals are the best way to simplify complex ideas. This isn’t an insight unique to me, in fact, many others including Nancy Duarte, Dan Roam, David McCandless, Willemien Brand, and Jamie Slater have expressed the power of visuals to clarify and synthesize your thinking.
Visuals Don’t Lie
During our hours sketching with sharpies on hundreds of 8.5 x 11 copy paper, it became clear that if we couldn’t visualize a practice or process, it probably wasn’t a fully baked idea at EE yet. For example, it was quite easy to visualize the way development is different at a responsive org like EE. In traditional organizations, development is often done to employees who sit through group training, meetings with managers, and formal performance reviews. At EE, employees drive their own development and have both the luxury and responsibility of creating a unique learning path. We easily captured this concept with a visual (see image below). However, we spent many hours and more than 50 sketches trying to find a way to visualize decision making at EE. At first, I felt frustrated that the visuals were failing to represent our decision-making processes. But Kawai helped me to realize that the visuals were telling us something critically important – decision-making at EE was still fuzzy and something we needed to continue to articulate and clarify as an organization. The visuals didn’t fail, they gave us a mirror to reflect on our current state of practice. As Willemien Brand’s infographic below shows, visuals can have a tremendous impact in helping individuals and teams learn, communicate, and work more effectively.
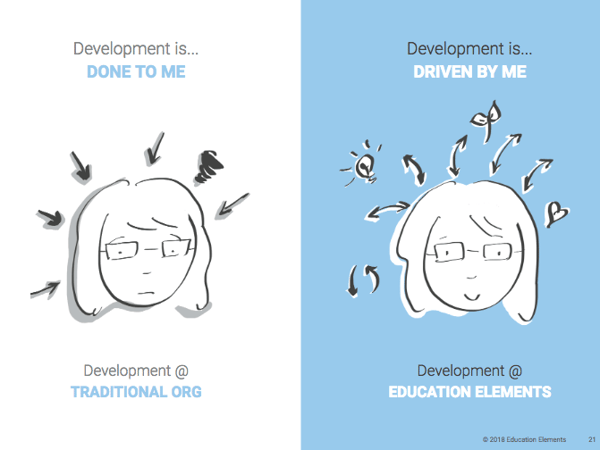
Image courtesy of Kawai Lai
Impact of Visuals
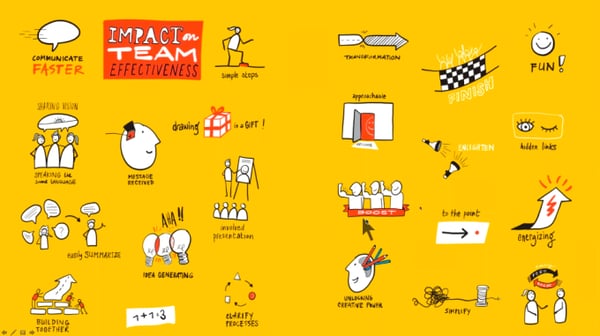
Image courtesy of Willemien Brand
How to start visualizing
If you want to start to bring more visual thinking into your day to day work, here are 5 things you can do in less than 20 minutes.
- Watch David McCandless’s TED Talk on the beauty of data visualization.
- Explore the book Visual Thinking.
- In your next meeting or 1-1 conversation try sketching, instead of telling your ideas. I love the one card concept as inspiration!
- Use Dan Roam’s Blah-Blahmeter to reflect on your current messaging.
- Join me in conversation @kearaduggan.
This blog post was originally published on The KikiBrief.